

Map and sensor data
Sensor Data
Channel selection, date ranges, graphs, reading tables and export controls in Sensor Data.
This article explains how to navigate to the tab, interpret what you see, and use the available tools to review and export data. This article applies to all user types.
Navigating to the Device Sensor Data tab
Section titled “Navigating to the Device Sensor Data tab”- From the main navigation, go to the Devices page.
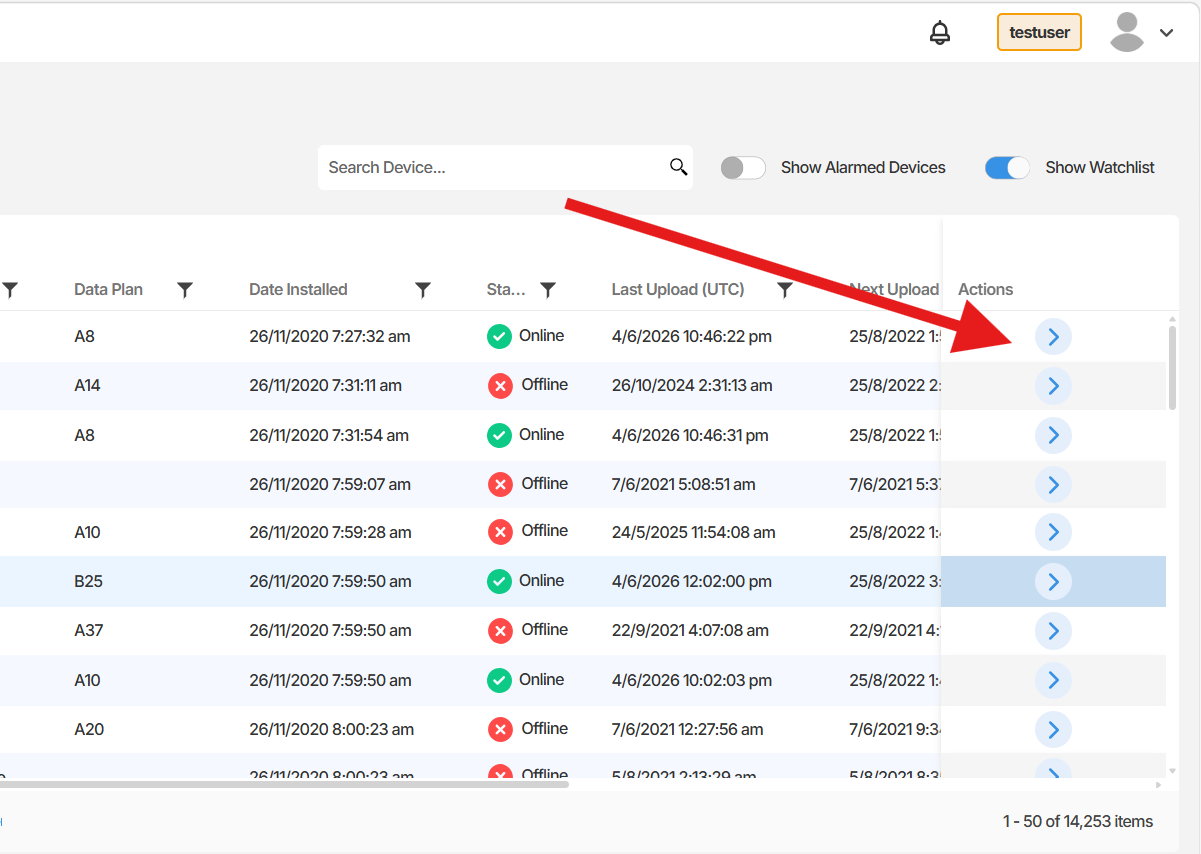
- Locate the device you want to inspect and click the right arrow on the right side of the device row. This opens the device configuration page.
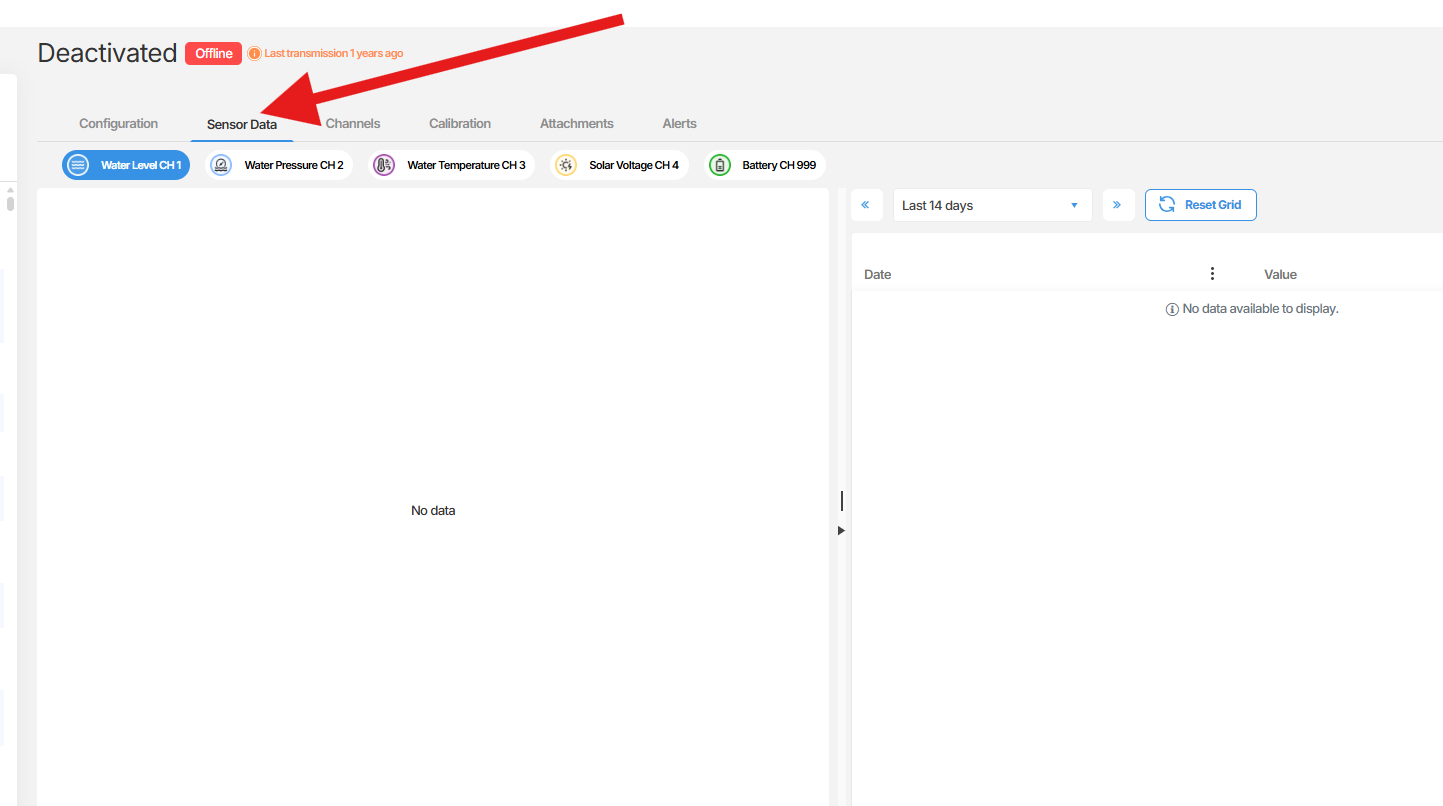
- On the device configuration page, click the Sensor Data tab. This is the second button in the top-left tab row.
Understanding the Sensor Data layout
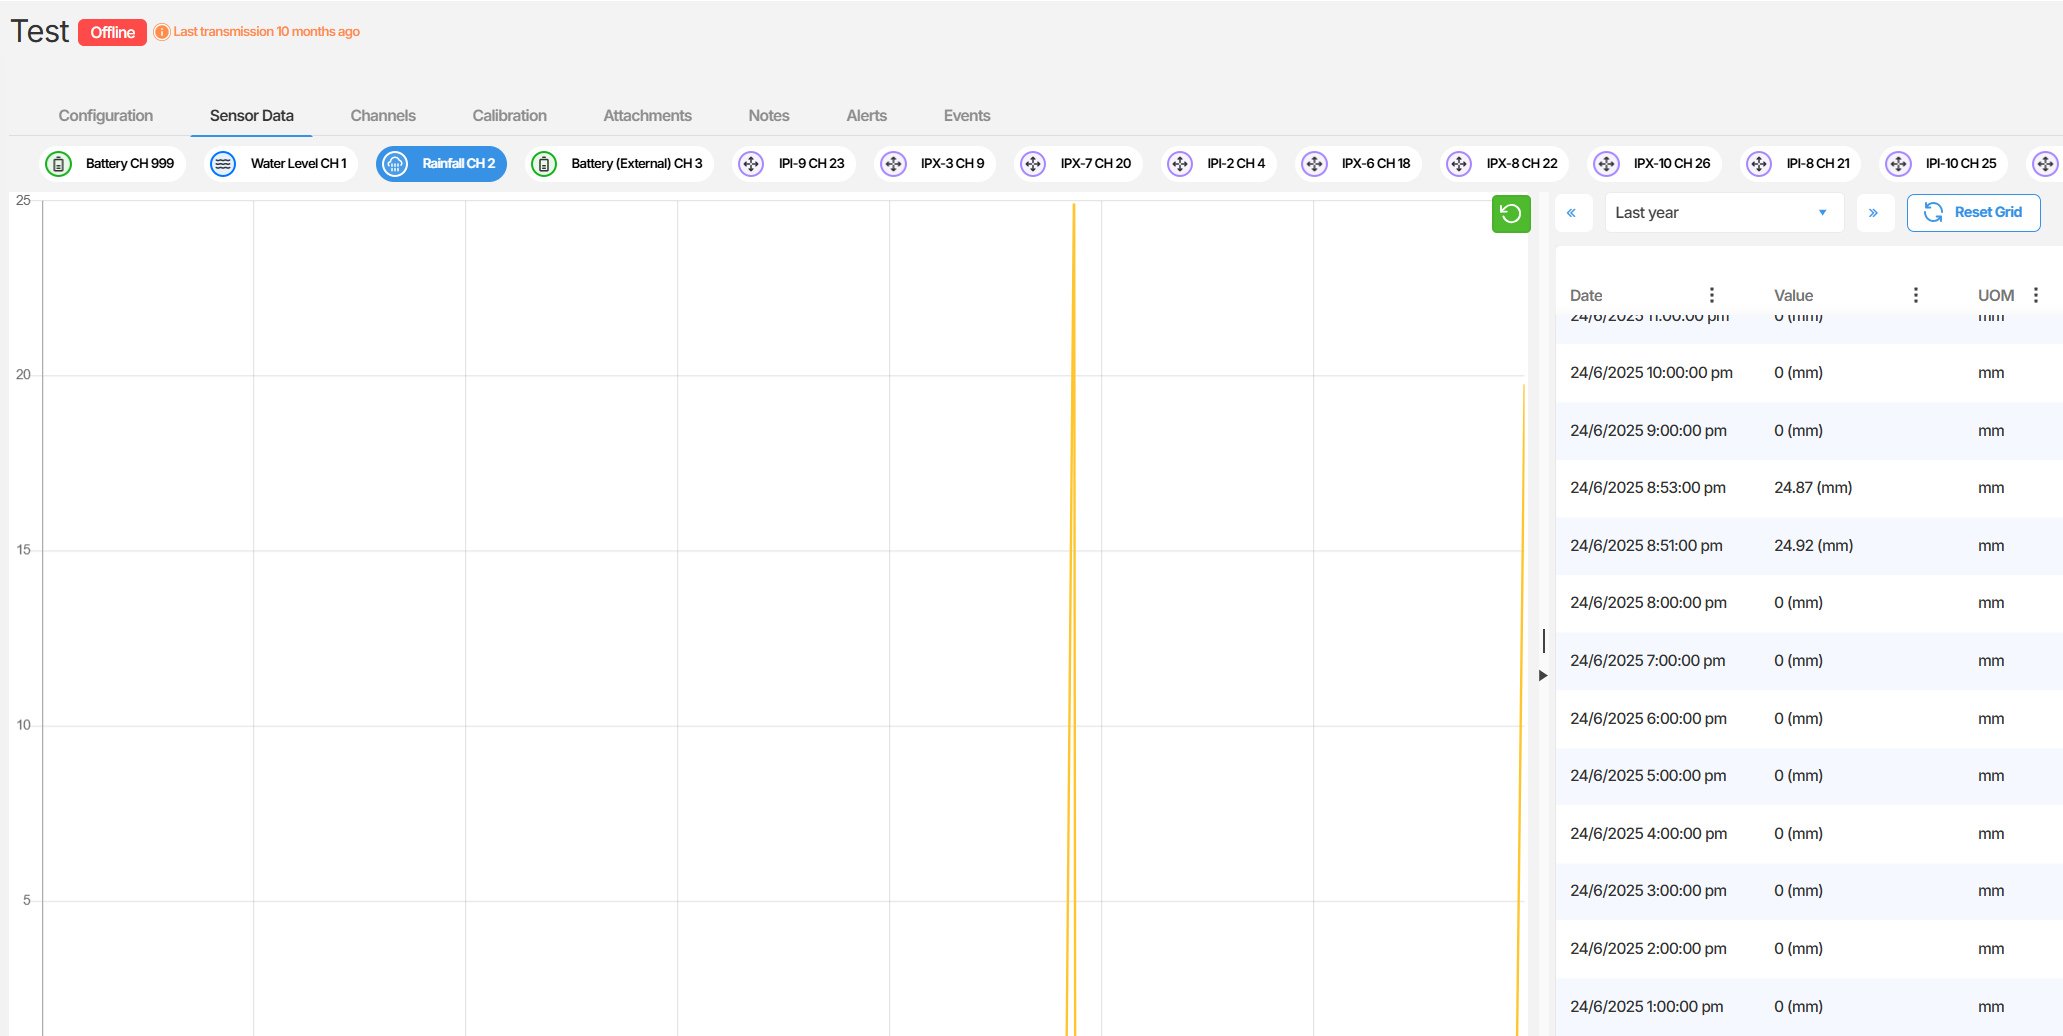
The Sensor Data tab is divided into two main areas.
Left panel - Data graph
The left panel displays a graph of the readings for the currently selected channel. The graph updates when you select a different channel from the list.
Right panel - Channel list and data table
The right panel lists all channels associated with the device, including any soft sensors. By default, it displays the last 14 days of data for the selected channel.
Selecting a channel and adjusting the date range
Section titled “Selecting a channel and adjusting the date range”A device can have multiple channels, each recording a different measurement. To switch between channels, select the channel name from the list on the left top above graph. The graph on the left will update to reflect the selected channel.
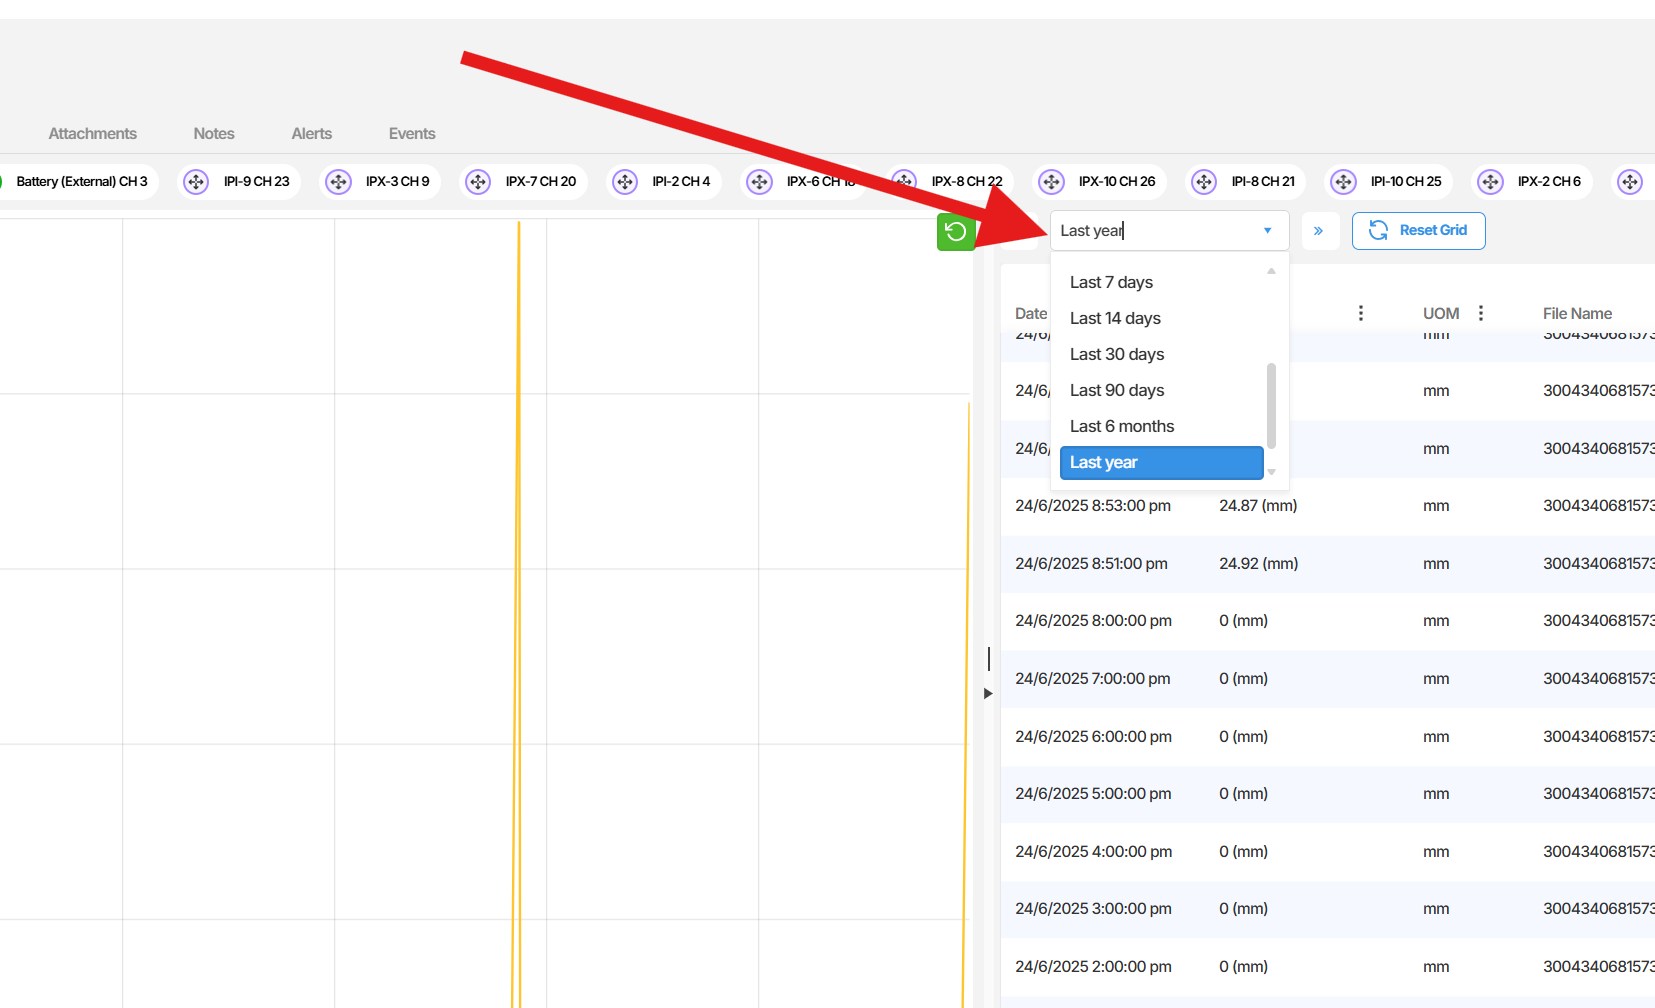
To adjust the time range of the data displayed, use the date range selector. You can view data from the last 30 minutes through to an absolute date range of your choosing.
Exporting sensor data
Section titled “Exporting sensor data”You can export the data for the selected channel as a CSV file using the export button located in the top-right corner of the data panel.
Using sensor data for diagnosis
Section titled “Using sensor data for diagnosis”The Sensor Data tab is a valuable tool for identifying and investigating device and sensor issues. By reviewing the readings across channels, you can identify patterns that indicate underlying problems.
Common diagnostic use cases include:
- Sensor faults - Unexpected spikes, flat lines, or missing data on a channel can indicate a sensor malfunction.
- Device issues - Erratic or inconsistent readings across multiple channels may point to a problem with the device itself.
- Battery condition - Monitoring the battery channel (for example, channel 999) allows you to track voltage over time. A decline from approximately 4V to 3.4V or below is a reliable indicator that the battery needs replacing.
Summary
Section titled “Summary”The Device Sensor Data tab provides a clear view of all channel readings for a device, with flexible date range options and a built-in CSV export. You can use it to monitor sensor performance, identify issues, and diagnose common problems such as battery degradation. It is available to all users across the platform.
Next Steps
Section titled “Next Steps”- Review the readings on each channel to confirm your device is recording data as expected.
- Use the date range selector to investigate a specific time period where an issue may have occurred.
- Export the data as a CSV file for further analysis or record keeping.
- If you identify a potential sensor or battery issue, refer to the relevant troubleshooting guidance.
Related articles
Section titled “Related articles”- Understanding devices in Orion Data
- Navigating the device configuration page
- Working with calibrations in Orion Data
- Setting up device alarms in Orion Data