

Orientation and account
Navigation and user roles
The main navigation, role-dependent menus and available device-list controls.
It covers the default landing page, the main navigation menu, and the key features of the Devices section, including the device list, column visibility, filtering, and how to access a device configuration page. This article is relevant to all users, including standard users, Calibrators, Super Users and Tenant Admins
The default landing page
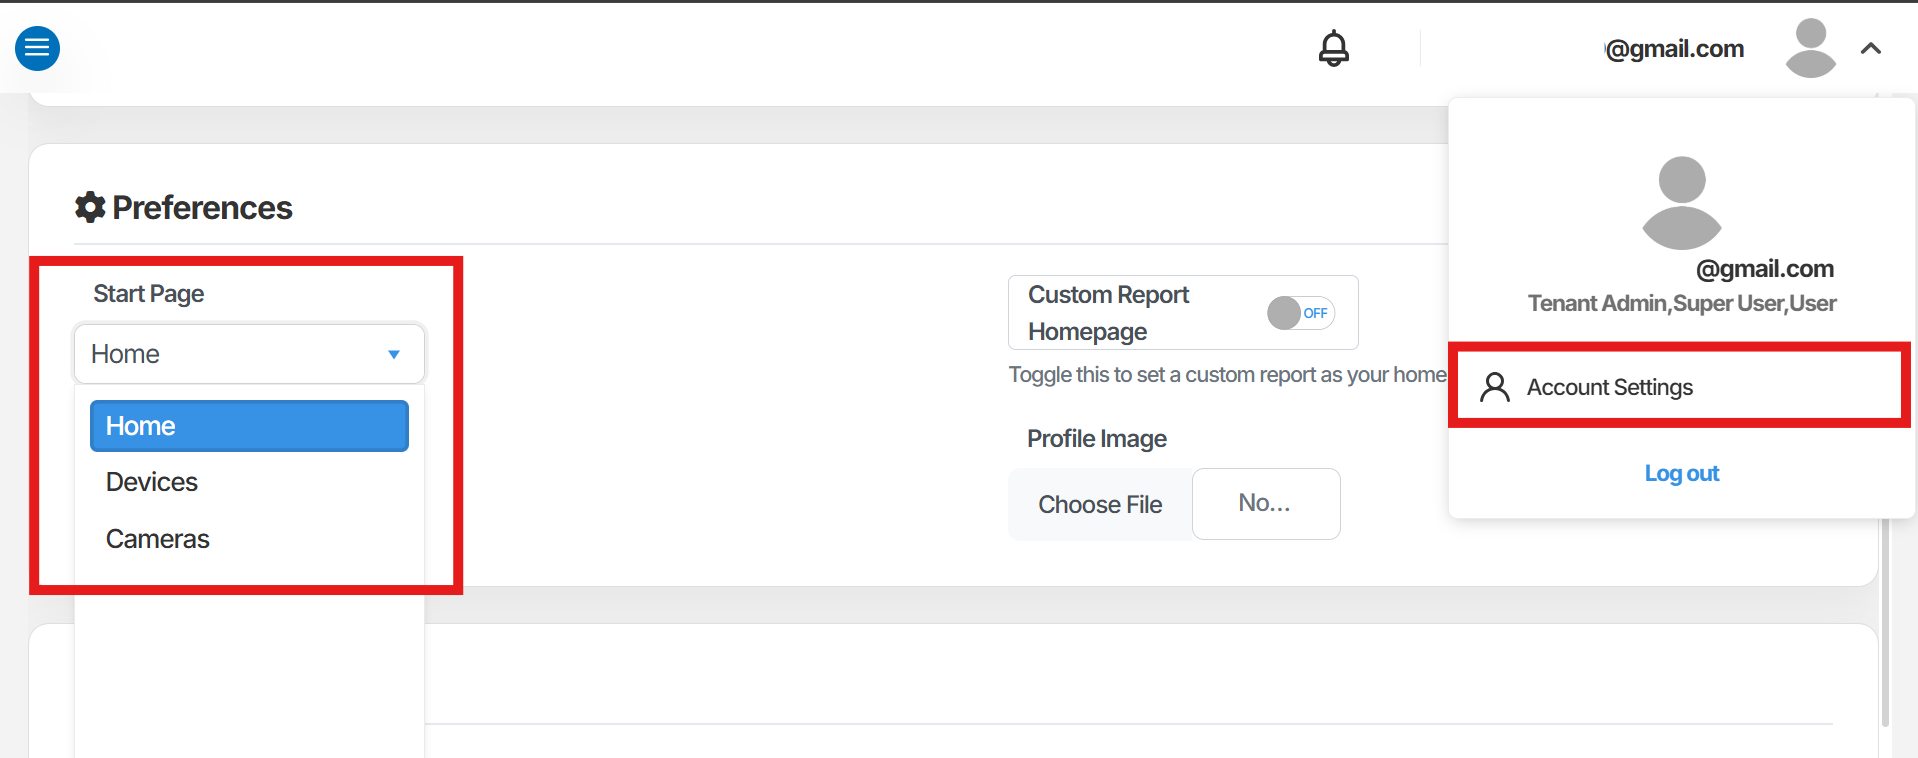
Section titled “The default landing page”When you log in to Orion Data, you are taken to a default landing page. This page can be set to one of three views:
- Home
- Devices
- Cameras
For most users, the default landing page is set to Devices. You can change your default landing page from your account settings.
The main menu
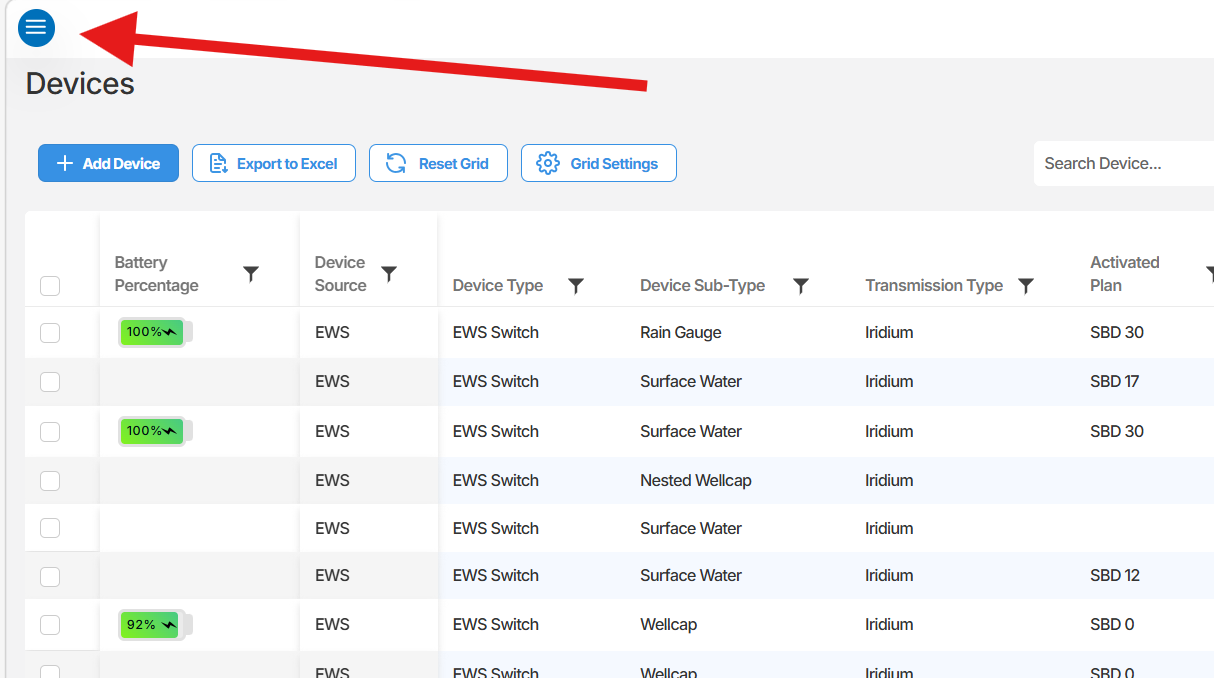
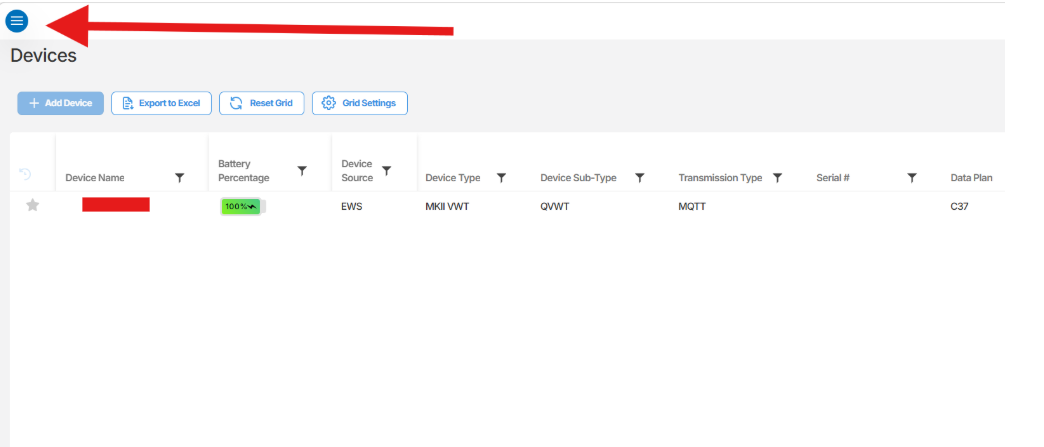
The main menu is accessible from any page in Orion Data. Select the three-line icon in the top-left corner of the screen to open it.
The menu items available to you depend on your user role.
Tenant Admin
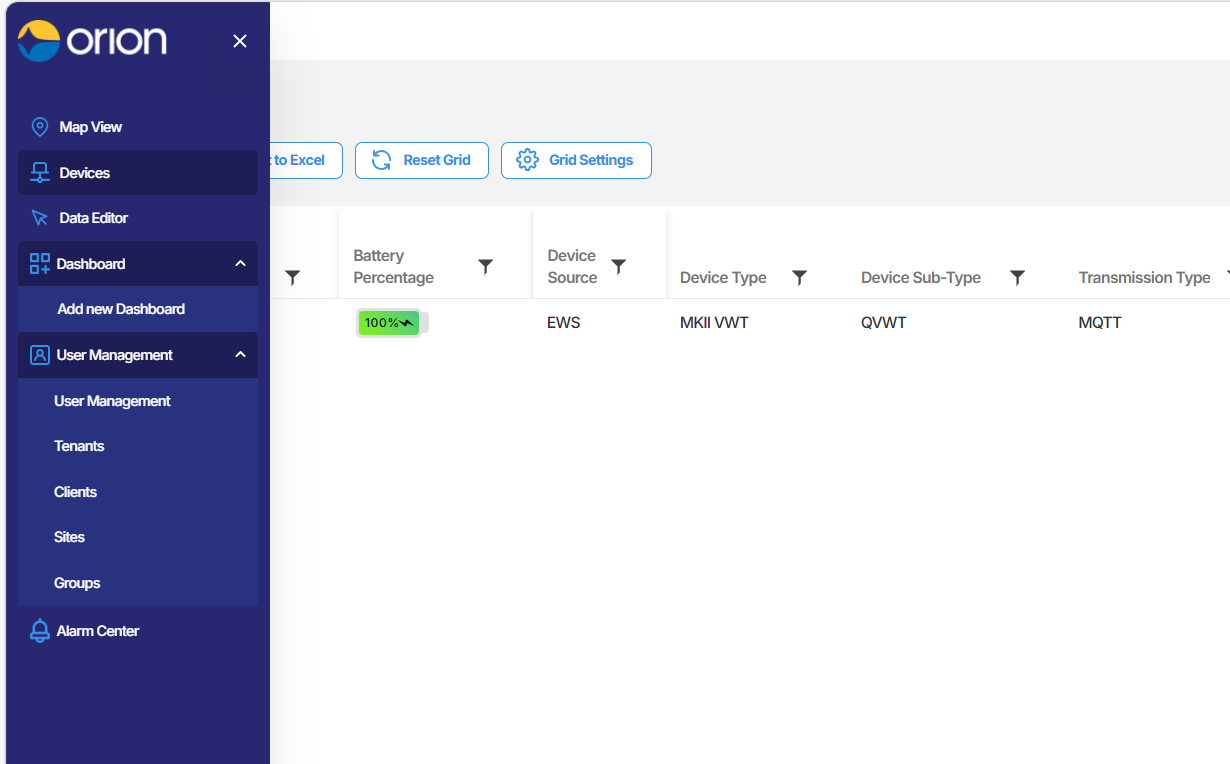
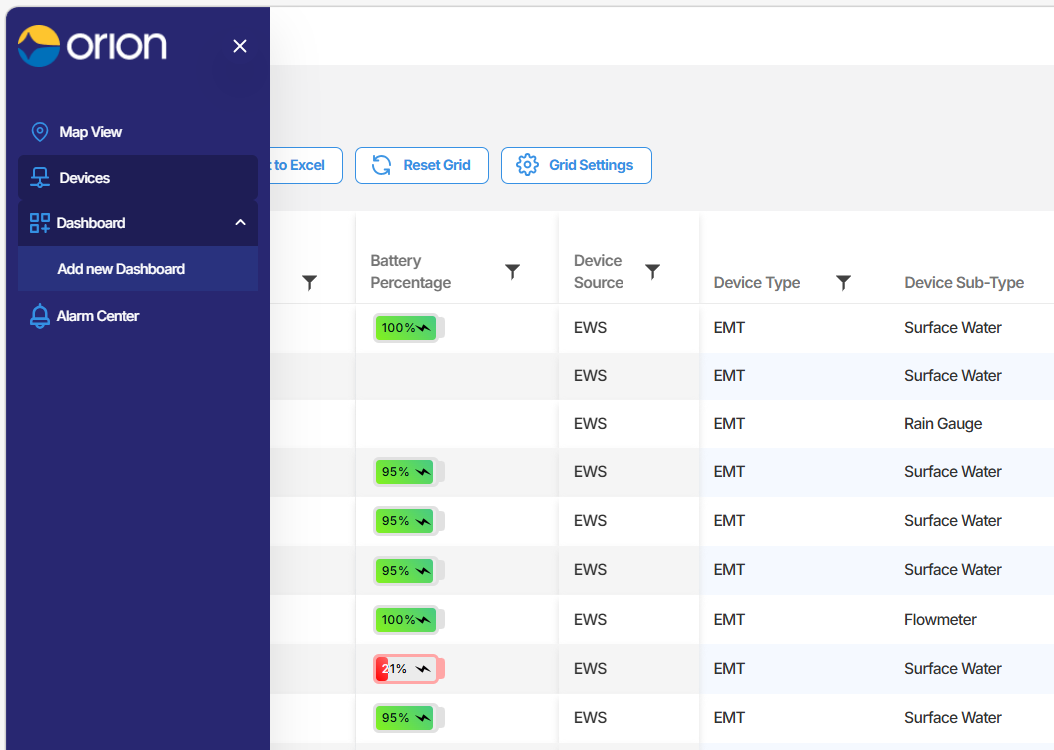
Tenant Admins have access to the full menu, which includes:
- Map View
- Devices
- Data Editor
- Dashboards (including Add New Dashboard)
- User Management, which contains:
-
- User Management
- Tenant
- Clients
- Sites
- Groups
- Alarm Centre
- User Management
All other users
Users with other roles, including standard users, Calibrators and Super Users see a reduced menu:
- Map View
- Devices
- Dashboards (including Add New Dashboard)
- Alarm Centre
The Devices section
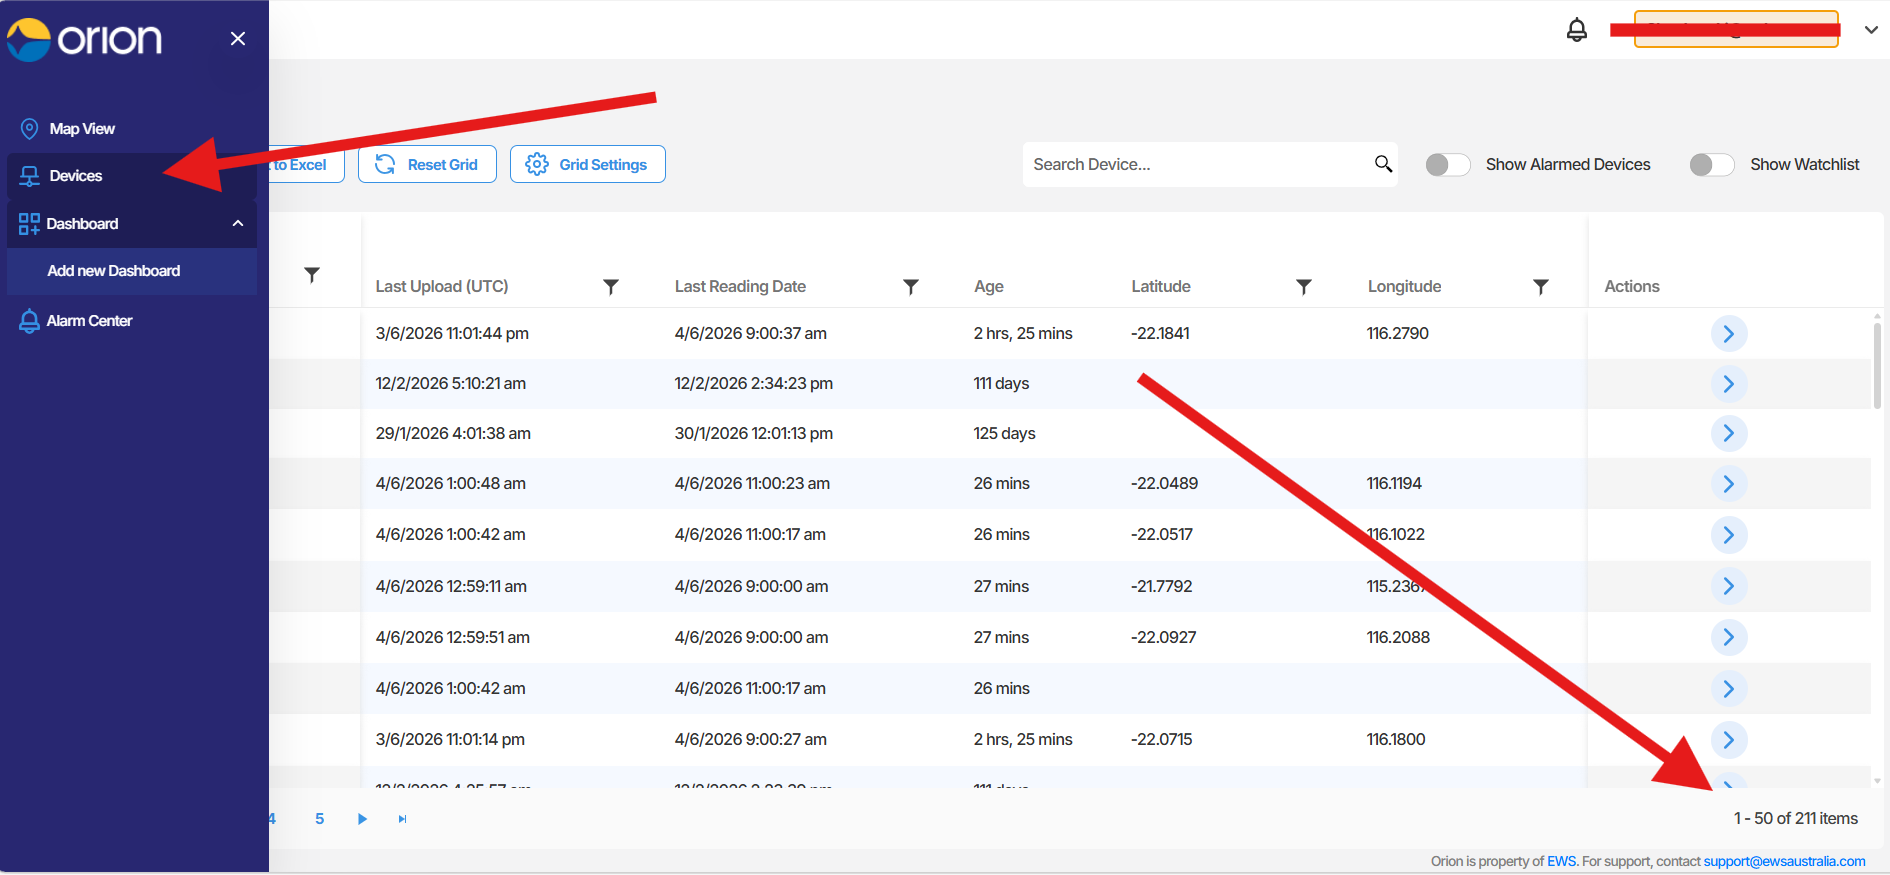
Section titled “The Devices section”The Devices section provides a list of all devices you have access to in Orion Data.
Device list columns
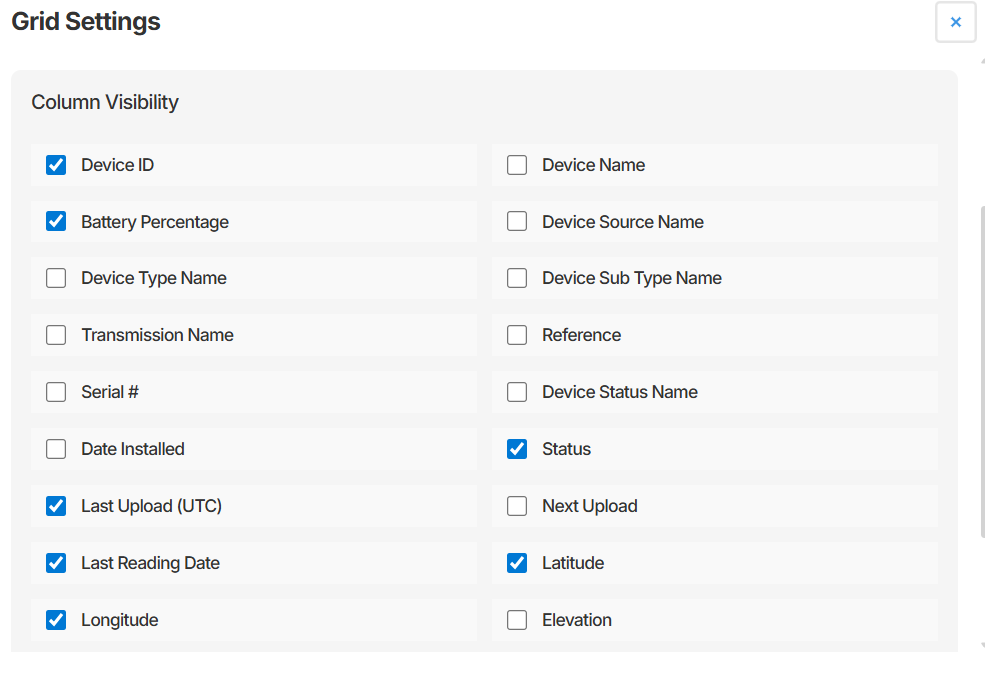
Section titled “Device list columns”The columns displayed in the device list can be customised. The following columns are available:
- Device Name
- Battery Percentage
- Device Source
- Device Type
- Device Sub-Type
- Transmission Type
- Reference
- Serial #
- Device Status
- Data Plan
- Date Installed
- Status
- Last Upload (UTC)
- Next Upload
- Last Reading Date
- Age
- Latitude
- Longitude
- Elevation
- Time Zone (Default)
- Time Zone (Override)
- Data Rounding (Minutes)
- Is Active
- Instrument Group
Column visibility is managed using Grid Settings. See the Grid Settings section below for details.
Filtering the device list
Section titled “Filtering the device list”Each column in the device list includes a filter control. Select the filter icon on any column header to filter the list by that column’s values. For example, to view only devices that are currently online, select the filter on the Status column and choose Online.
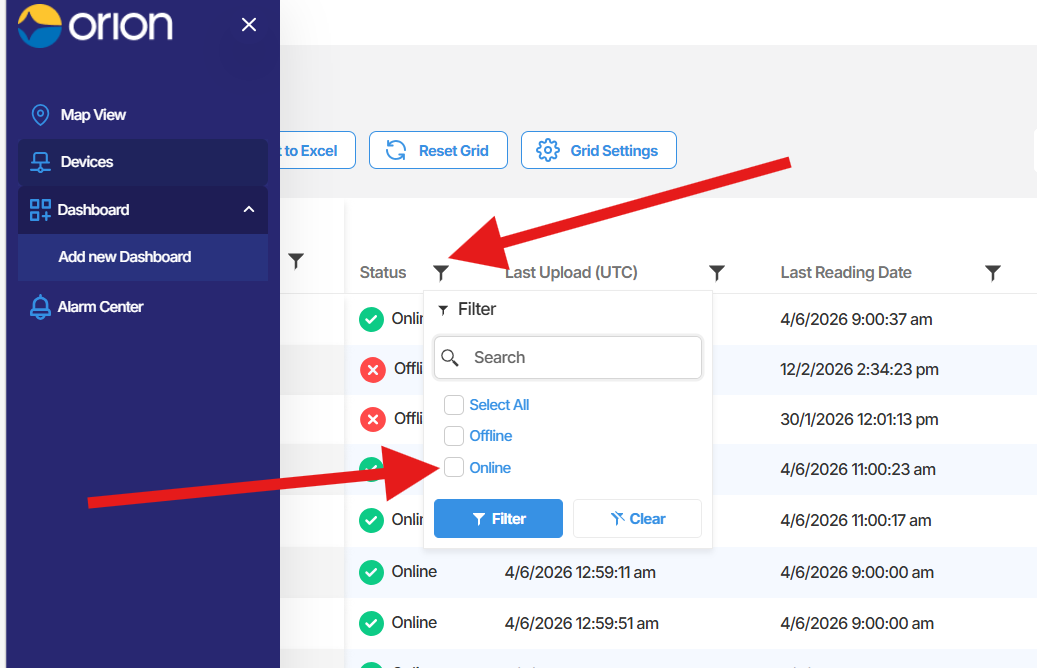 You can apply filters across multiple columns at the same time to narrow the list further.
Admin and Super User controls
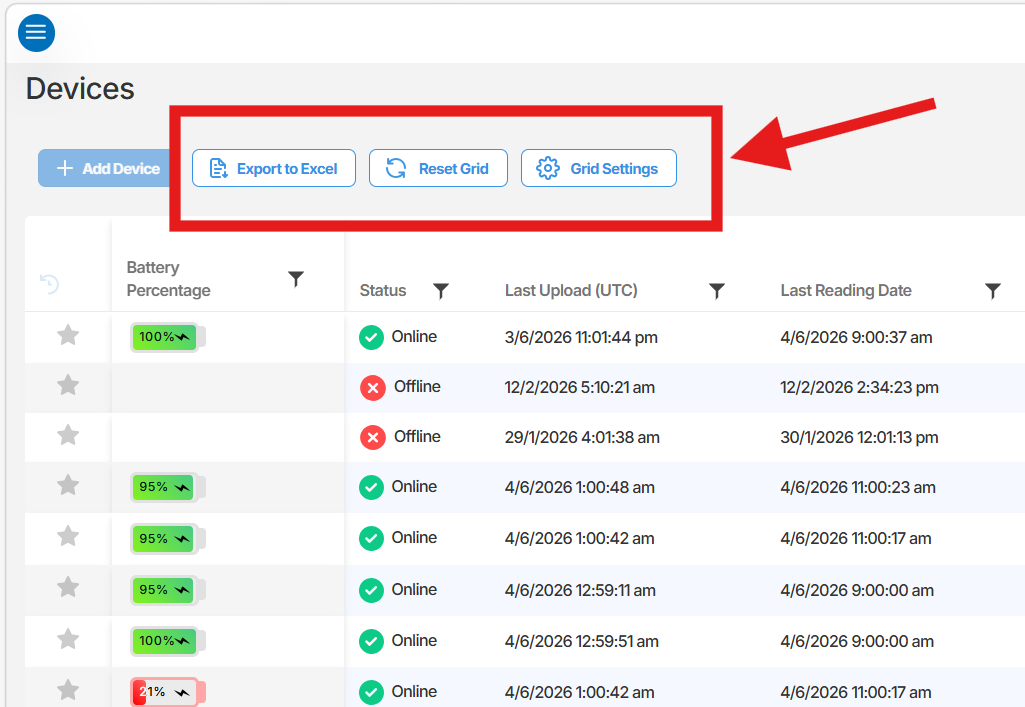
Section titled “Admin and Super User controls”The following controls are available to Tenant Admins and Super Users.They appear as buttons above the device list.
Export to Excel
Section titled “Export to Excel”Select Export to Excel to download the current device list as an Excel file. The export runs immediately without a confirmation prompt.
Reset grid
Section titled “Reset grid”Select Reset Grid to restore the device list columns and layout to their default configuration.
Grid settings
Section titled “Grid settings”Select Grid Settings to control which columns are visible in the device list. Use this to show or hide columns based on the information most relevant to your workflow.
Accessing a device configuration page
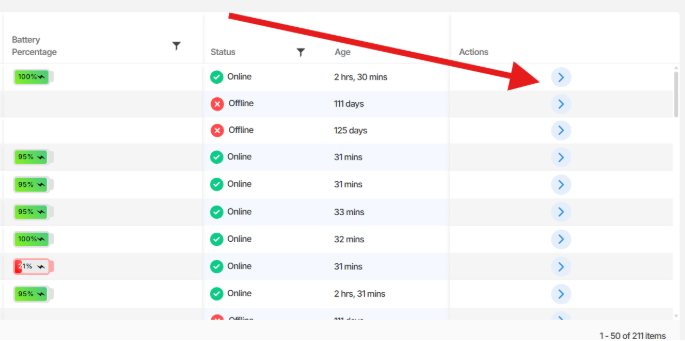
Section titled “Accessing a device configuration page”Each device in the list has an action control on its row. Select the Action right arrow for a device to open its configuration page.
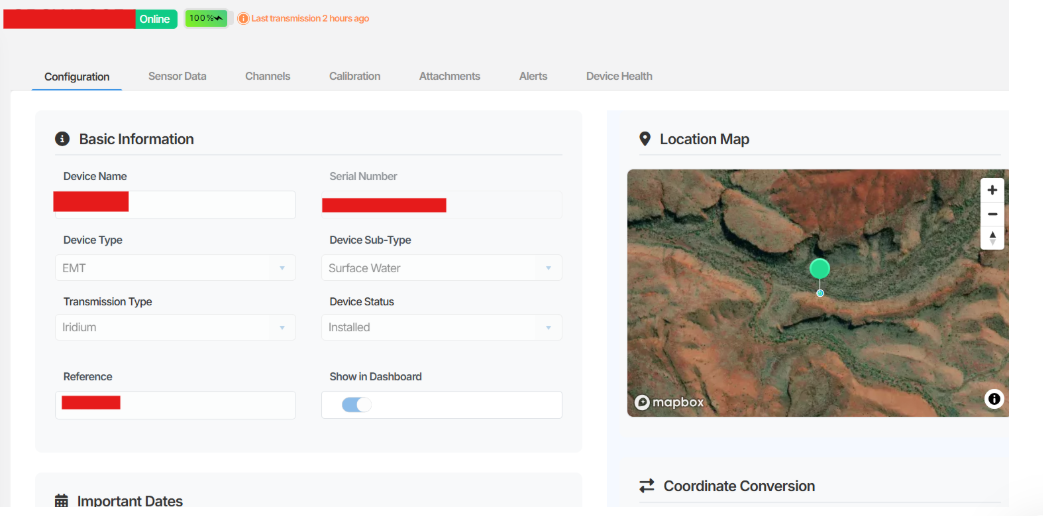
The device configuration page is the central hub for that device. From here you can access a wide range of data and settings, including:
- Sensor readings and data history
- Alarm configuration
- Calibration settings
- Device notes and attachments
- Device events
Summary
Section titled “Summary”This article introduced the Orion Data interface, covering the default landing page, the main navigation menu, and the key features of the Devices section. You learned how to navigate the menu based on your user role, how to customise and filter the device list, and how to access a device’s configuration page.
Next Steps
Section titled “Next Steps”- Explore the Map View for a geographic overview of your devices
- Open a device configuration page to review sensor data and settings
- Use Grid Settings to customise the device list columns for your workflow
- Visit the Alarm Centre to review any active or historical alarm events