

Map and sensor data
Map View
The map canvas, device markers, search and sensor-channel panels in Map View.
This article introduces the Map View interface, explains the key elements you will encounter, and shows how to begin exploring your device network.
Navigating to Map View
Section titled “Navigating to Map View”Map View is accessible at any time via the main navigation menu on the left-hand side of the screen. Select Map View from the menu to open it.
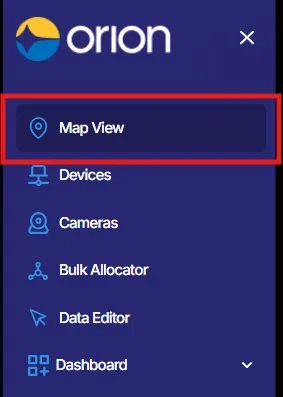
While Map View is the default landing page for new users, your platform administrator may configure a different default view based on your organisation’s preferences.
The map canvas
Section titled “The map canvas”When you open Map View, you will see an interactive satellite map displaying the geographic locations of your devices. Each device is represented by a coloured marker positioned at its installed coordinates.
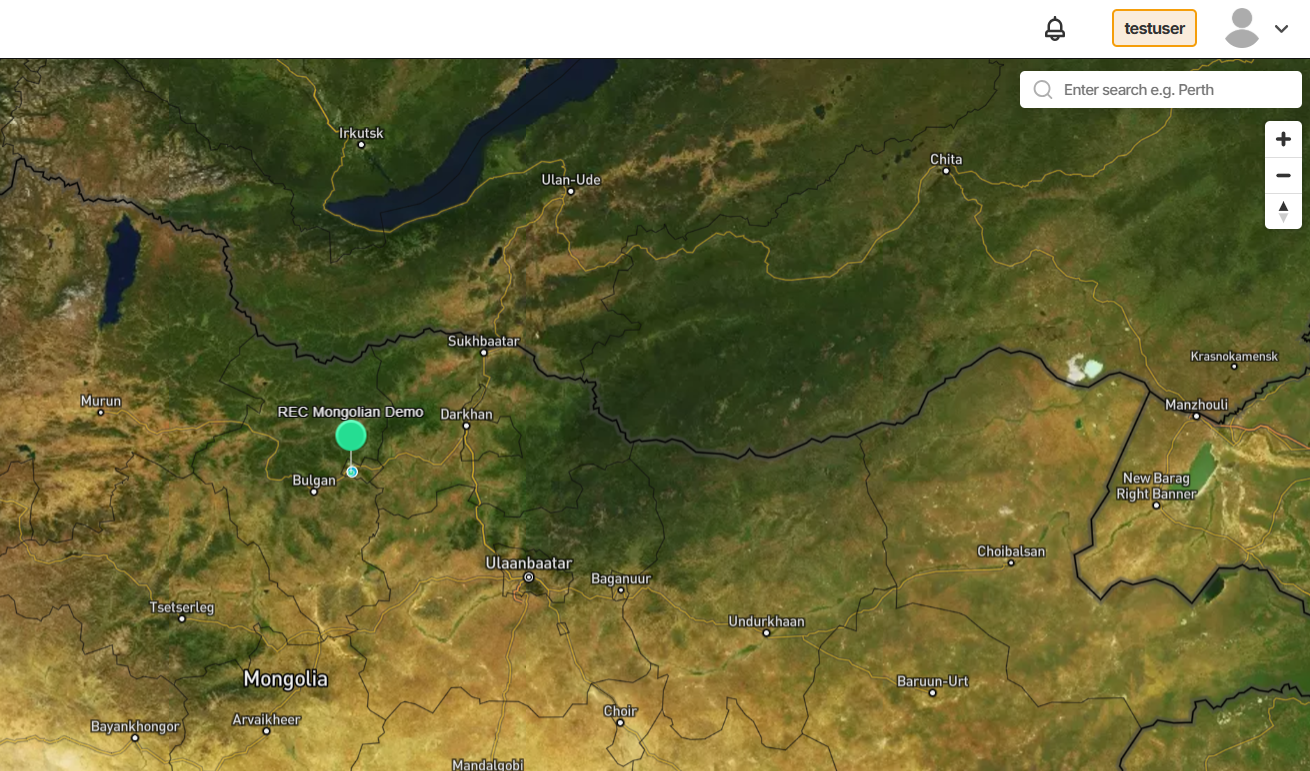
You can pan the map by clicking and dragging, and zoom in or out using the + and - controls on the right-hand side of the map. An orientation reset button is also available below the zoom controls to return the map to its default north-facing orientation.
Device status indicators
Section titled “Device status indicators”Each device marker on the map uses colour to indicate its current connection status. A green marker indicates the device is online and transmitting data. Red markers indicate an offline device. This allows you to identify connectivity issues across your network at a glance, without navigating to individual devices.
The device information panel
Section titled “The device information panel”Selecting a device marker opens a device information panel overlaid on the map. This panel displays the core properties of the selected device, including:
- Serial Number
- Date Installed
- Date Activated
- Latitude and Longitude
- Device Type
- Device SubType
- Transmission Type
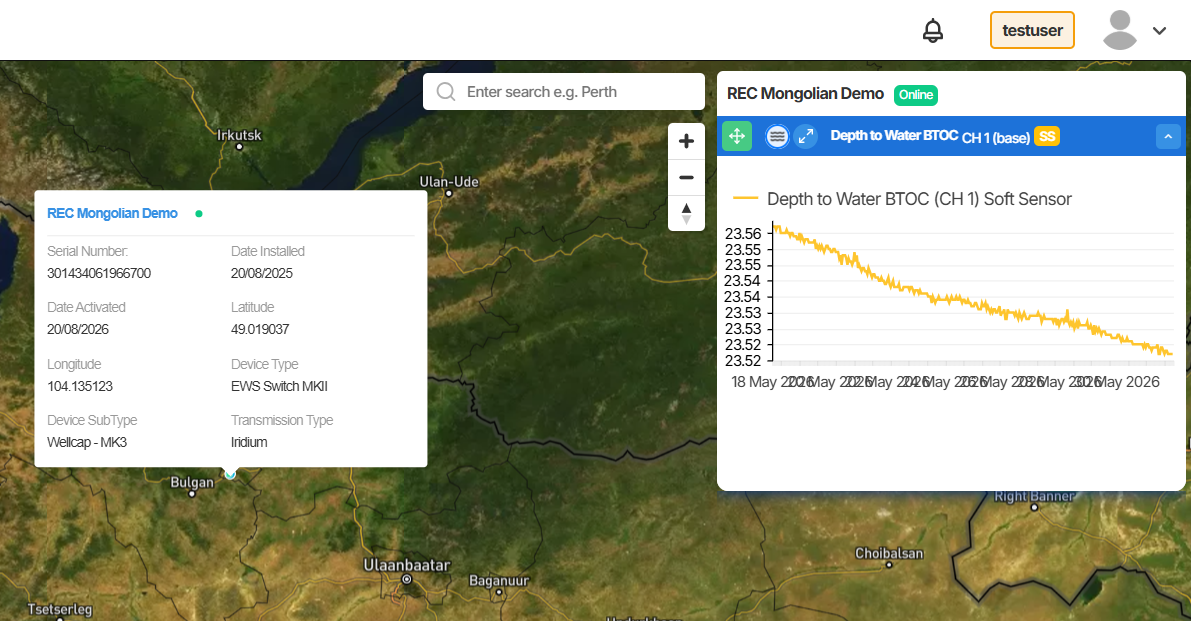
This panel gives you immediate access to key device properties without leaving Map View.
Viewing sensor channels
Section titled “Viewing sensor channels”When a device is selected, a sensor channel panel appears in the top-right corner of the screen. This panel lists the available sensor channels for that device and allows you to expand a channel to view its current reading directly within Map View.
This is particularly useful during initial monitoring checks or when you need to quickly assess live data in geographic context, without navigating to the full device view.
Searching for a device
Section titled “Searching for a device”A search bar is available in the top-right area of the Map View screen. Use it to locate a specific device or place by name. The search bar displays placeholder text reading “Enter search e.g. Perth” to guide new users.
This is especially useful when your device network spans a large geographic area and manually panning the map would be time-consuming.
Summary
Section titled “Summary”Map View is the default starting point in Orion Data and gives you a live geographic overview of your entire device network. From the map canvas you can check device status at a glance, access individual device details, view sensor channel readings, and search for specific devices, all without leaving the map interface.
Next Steps
Section titled “Next Steps”- Select a device marker on the map and review its sensor channel readings
- Explore the Devices section for full device configuration and management options
- Learn how to set up alarms to receive notifications when sensor readings exceed defined thresholds
- Review your navigation preferences with your platform administrator
Related articles
Section titled “Related articles”- Getting started with Orion Data
- Understanding the Devices section in Orion Data
- Setting up sensor alarms in Orion Data
- Navigation and user roles