

Build and share dashboards
Add a widget to a dashboard
Add a tile, select its visualisation and sensor series, then save it to a dashboard.
For a full explanation of each tile configuration field and the available tile styles, see Chart tile settings.
Before you begin
Section titled “Before you begin”You will need access to an existing dashboard and a role that permits editing. If you do not have edit access, contact your administrator.
Adding a new tile
Section titled “Adding a new tile”- Open the dashboard you want to edit.
- Select the + button in the dashboard toolbar.
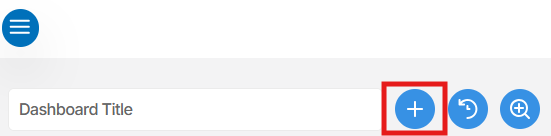
The Edit Tile panel will open on the right side of the screen.
Configuring the tile
Section titled “Configuring the tile”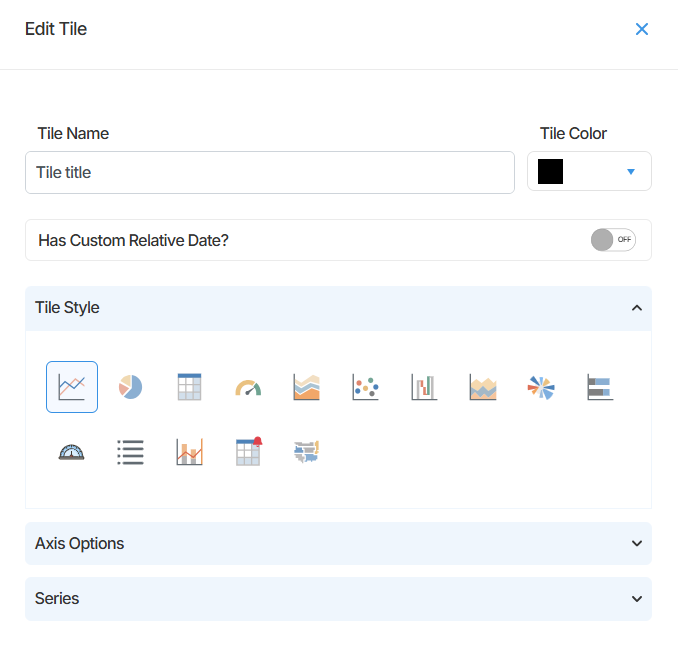
- Enter a name in the Tile Name field. This appears as the header on the tile.
- Select a colour using the Tile Color picker if required.
- If this tile needs to display a different time period from the rest of the dashboard, enable the Has Custom Relative Date toggle and set the desired range.
- Select a visualisation style from the Tile Style selector.
- Adjust the Axis Options if required. For most tiles, the default Auto scaling is sufficient.
Adding a series to the tile
Section titled “Adding a series to the tile”A tile must have at least one series assigned to display data. Multiple series can be added to a single tile, including data from different devices.
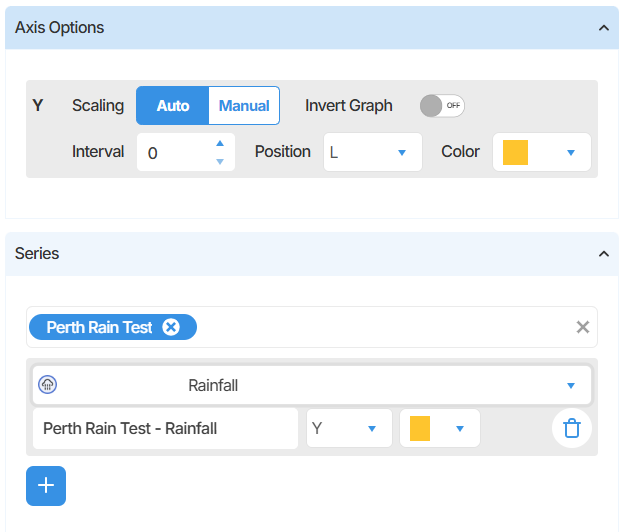
- In the Series section, select the device you want to use as the data source. The device tag will appear once selected.
- Use the Select Series dropdown to choose the specific sensor channel to display.
- Enter a Label for the series as it will appear in the tile legend.
- Assign the series to a Y axis and select a colour for the series.
- To add another series, repeat the preceding device, channel, label and axis selections.
Saving the tile
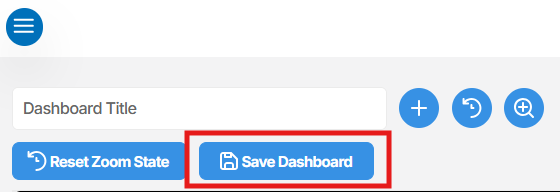
Section titled “Saving the tile”- Once the tile is configured, select Save Tile to add it to the dashboard canvas.
Arranging tiles on the canvas
Section titled “Arranging tiles on the canvas”After saving, the tile will appear on the dashboard canvas. You can reposition and resize it to suit your layout.
- To move a tile, select and drag it to the desired position on the canvas.
- To resize a tile, drag the edges or corners of the tile.
Editing an existing tile
Section titled “Editing an existing tile”To make changes to a tile that has already been added:
- Select the tile you want to edit on the dashboard canvas.
- The Edit Tile panel will open with the current configuration loaded.
- Make the required changes and select Save Tile to apply them.
Deleting a tile
Section titled “Deleting a tile”To remove a tile from the dashboard:
- Click the Tile panel for the tile you want to remove.
- Go to the top right of the panel and select Delete tile.

The tile will be removed from the dashboard canvas immediately.
Summary
Section titled “Summary”Tiles are added to a dashboard using the + button in the toolbar, configured using the Edit Tile panel, and saved with Save Tile. Once on the canvas, tiles can be repositioned and resized freely. Existing tiles can be edited or deleted at any time by opening the Edit Tile panel for that tile.
Next Steps
Section titled “Next Steps”- Add the Date Filter Options to control the time period shown across your dashboard tiles
- Review Chart tile settings for chart settings
- Arrange your tiles into a layout that suits your monitoring workflow